Wednesday, March 14, 2012

Range Bar Chart (Gantt Chart) using SSRS 2008

I prepared a step-by-step introduction to GANTT chart so that developers will get a good starting point for developing GANTT Chart using SSRS 2008.
Main Criteria for Range Bar Chart is the data that is used to display in the graph.
The dataset that is used should return at least three details.
· Task Name
· Start Date,
· Duration or End Date for the task.
Assuming that my dataset returns all the three details, I am going ahead to create the Gantt Chart.
My dataset returns TaskName, StartDate, EndDate.
From Tool window, drop the Chart control in report body and you will see the below window, and select Range Bar chart as heighted below.

After clicking OK, this what you see in the report body.
Let’s discuss something about what we see here.
Category Fields:
This is the area where you will drop your fields to group the data, here I dropped the TaskName. So data is now grouped by TaskName. You can have multiple fields in category fields. I tried with 4 categories, and it worked like a champ.
Right click on the dropped category fields, select Category Group Properties.
Here you can control the label text.
Data Fields:
This is the section where we specify our start and end dates for the tasks. The fields you drop here has High and Low values (like a pair High, Low values). It’s highlighted in the image below.

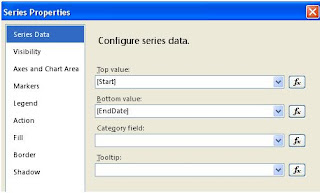
Now Right Click on the dropped, and field and select Series Properties. This is the very important information that needs to be updated.
Here Top value can be EndDate or (Duration + StartDate) and the Low value is StartDate. You can click on Fill and specify a color for this series Bar.
Now Click on the dropped field, and it will select the series in the graph. Right click on this and select Show Data Labels.
Interestingly SSRS 2008 is very flexible in showing the labels, and colors for the bar dynamically based on expressions you define. This is screen you see after selecting the Show Data Fields.
Customizing the series bar:
SSRS 2008 provides wide range of options to control the data series bar. I am going to discuss a few here and you can explore more.
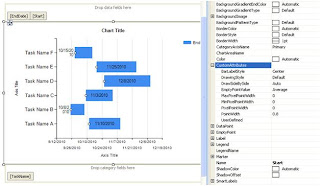
Let me start with the label text. By default it shows the date as the label text. But in most of the cases we may need to show the Task Name or Subtask Name. Here what you need to do. Select the data series by clicking on the graph data series bar or clicking on the data fields section and open the Properties window (not the right click series properties) (Ctrl W P).

If you observe there is Boolean field UseValueAsLabel with value True. Because of this, it shows the date as label text by default. If you want custom label text, then change this to false and change the Label field here. I changed it to display TaskName by changing the Label value to “Fields!TaskName.Value”. You can have custom expression to populate the label. You can also customize the font colors, font widths, formatting borders for this label in this label section.
Now we move to the CustomAttributes section. This is very important part for the Gantt Chart for customization. Now let’s see what is there in it and how you can modify according to our requirements. I am discussing only the options I have explored till now.
BarLabelStyle:
This controls the label text alignment. Available values or Center,Left,Right,Outside. Selecting outside will show the label, just before the data series bar. You can select any value, and the default value is Center.
DrawingStyle:
This controls the drawing style like cylinder type bar or regular bar. Here is the list:
DrawSideBySide:
This is very interesting attribute. Here is example where we can use it.
I have a task with multiple subtasks and all my sub tasks are sequential (like first task end date is second task start date). In this case I want to show all the bars in same line, and with different colors. By setting value to “False”, this will allow us to show all data series bars related same grouping category to be displayed in the same line like shown below.
To view all the sub task data series group in one line, you need to set this DrawSideBySide to False for all the sub task data series.
PointWidth:
This is the field that controls the data series bar width. Maximum value is 1, and minimum value is 0. As you can see the default value is 0.8. If you want see like a line, then you can give like 0.05 or 0.1
In the same properties window, you can customize any field like Color with custom expressions.
Customizing the Axis Properties:
Right click on the Value Axis (X-Axis), select Value Axis Properties.
Under Axis Options, you have various options to customize the labels to be shown. By default it will show the date in short date format.
If you run the report, by default it will show only alternate labels both in X and Y axis. To view all the labels you need to check the check box Enable Variable interval. This is very common thing we may tend to forget.
You can give a specific Minimum, and Maximum values. You can specify an expression like Minmum is MIN(Fields!Start.Value) and Maximum is MAX(Fields!EndDate.Value).
Interval, Interval Type: I guess the name says it all. What is the interval (digit) and what is the interval type (Hours, Minutes, Weeks, Days, ..) you want to show in the value axis. Accordingly you can change the display format in Number section. If you want to show the dates in HH:MM format, you can change it like given below.
Or you can give any specific format you want. You can check out the options available for Labels, Label font sections here.
If you select the value axis (x-axis) and go to properties window you will see a wide range of fields you can customize. You can specify minor, major grid intervals, with specific colors, widths. You can always hide the axis (both X and Y) and you can hide the minor major grids and also minor major grid ticks.
Major, Minor grids applicable to chart area and major, minor grid ticks applicable to the labels section of the grid
Most of the properties are applicable to Y Axis as well (Series Axis Properties).
And here is the final Report out I got with Interval type Hours.
You can always customize the legends for the chart.
Here are some Gantt Charts report outputs I developed using SSRS 2008 Range Bar Chart:

Another example:
The above gantt charts are developed using multiple GANTT Charts with the same set of data.
Hope this is helpful

Monday, March 12, 2012

Disable “Open in Windows Explorer” on SharePoint

Ribbon is introduced in SharePoint 2010. We can easily make customization it by using the Feature Infrastructure. In order to hide a button, say the “Open with Explorer”, "Download Copy" ...etc we will need to create a feature. We start by creating a new folder called “DisableRibbonButton”. Create a new file called “feature.xml” in the new folder and insert the following XML into the file

 <?xml version="1.0" encoding="utf-8" ?>
<Feature Id="33057CD9-6D14-45c9-83ED-5E1FE066AC92"
Title="DisableRibbonButton"
Description="DisableRibbonButton"
Version="1.0.0.0"
Scope="Web"
xmlns="http://schemas.microsoft.com/sharepoint/">
<ElementManifests>
<ElementManifest Location="Manifest.xml" />
</ElementManifests>
</Feature>

Then create another file called “Manifest.xml” and insert the following XML:

<?xml version="1.0" encoding="utf-8"?>
<Elements xmlns="http://schemas.microsoft.com/sharepoint/">
<CustomAction
Id="RemoveExplorerButton"
Location="CommandUI.Ribbon"
RegistrationType="List"
RegistrationId="101">
<CommandUIExtension>
<CommandUIDefinitions>
<CommandUIDefinition
Location="Ribbon.Library.Actions.OpenWithExplorer" />
</CommandUIDefinitions>
</CommandUIExtension>
</CustomAction>
</Elements>

The above XML is to remove the “Open with Explorer” button from the Ribbon for all list with type ID 101, hence all the Document Library type.

The location “Ribbon.Library.Actions.OpenWithExplorer” is the ID that is registered in the default Ribbon button XML, which can be found in C:\Program Files\Common Files\Microsoft Shared\Web Server Extensions\14\TEMPLATE\GLOBAL\XML\CMDUI.XML”

Now we will execute the following Cmdlet using the “SharePoint 2010 Management Shell” to install and active the feature:

Install-SPFeature DisableRibbonButton
Enable-SPFeature DisableRibbonButton –url http://<servername>

Create Enterprise wiki from Central Administration

  1. Open the SharePoint Central Administrator (CA)
  2. In the left navigation (Quick Launch), click Application Management
  3. Under Site Collection group, click Create Site Collection
  4. Select the web application, for the Wiki site from the dropdown menu
  5. Type “My Wiki Site” in the title and fill the description (Optional)
  6. For the web site address, type a proper character (ex: MWS)
  7. In the template selection area, select the proper language if you installed more than one language then select the Publishing Tab and “Enterprise Wiki
  8. Specify the Primary and Secondary Administrator
  9. And finally select the right quota or leave it “No Quota” then click OK

How to Use Enterprise wiki


From the wiki page you can connect to other resources such as pages, lists, views and items without leaving the page which give you the ability to write the discussion faster and without linking error.

Connect to other Page

  1. Click the “Edit This page” link to move to the edit mode
  2. In the content editor, type “[[” to open the menu
  3. The menu will include the all pages available in the site as well List: and View: records
  4. Select the page then type “]]”
Connect to Page from Wiki Site

Connect to List

  1. Repeat the above steps 1 and 2
  2. Select the List: then press Tab which will open the all available list
  3. Select one then type “]]”
Connect to List from Wiki Page

Connect to View

  1. Repeat the above steps 1 and 2
  2. Select the View: then press Tab which will open the all available list
  3. Select the List you want then the view menu will open immediately
  4. Select one of the available views then type “]]”
Connect to List or Library View from Wiki

Link to List Item

In Wiki page you can immediately connect or link to item directly:
  1. Type [[
  2. Select “List:” then press Tab
  3. Select the list or library then press Tab again
  4. The menu will now show the all available items
  5. Select the item then press ]]
Connect to List Item from Wiki Page

Change the Link Name

To change the displayed text for the link, before typing the “]]” just type “|” and the text you want to show then type “]]”.


Wednesday, March 7, 2012

Hide SharePoint 2010 Ribbon for Read/View users

The SharePoint 2010 Ribbon is a very good feature, but in some case you need to hide the ribbon from users who does not have access to edit the page. Here you can hide ribbon from users who does not have edit access by modifying in the master page in SharePoint 2010.

First take a backup for your v4.master page and open in SharePoint Designer.

After taking the backup, now check out the master page and search for <div class="s4-title s4-lp"> and replace this with <div class="s4-title s4-lp" id="HeaderNavID" style="display:none">.
We have given one id property which is id="HeaderNavID" and one style property which is style="display:none"

Now go to the close
</div> tag of the above div <div class="s4-title s4-lp" id="HeaderNavID" style="display:none"> and place the below code
<Sharepoint:SPSecurityTrimmedControl ID="SPSecurityTrimmedControl2" runat="server" PermissionsString="AddAndCustomizePages">
<script type="text/javascript">
document.getElementById("HeaderNavID").style.display = "block";
</script>
</Sharepoint:SPSecurityTrimmedControl>

Happy SharePointing!!!

Powershell commands to Install-Activate-Deactivate and Uninstall SharePoint Feature

Powershell commands to:

-Install Feature:

Install-SPFeature FeatureFolderName
Here FeatureFolderName folder must be presented inside C:\Program Files\Common Files\Microsoft Shared\Web Server Extensions\14\TEMPLATE\FEATURES directory.

-Activate/Enable Feature:

Enable-SPFeature FeatureFolderName -Url http://ur-site-url

-Disable Feature:

Disable-SPFeature FeatureFolderName -Url http://ur-site-url
Here FeatureFolderName folder must be presented inside C:\Program Files\Common Files\Microsoft Shared\Web Server Extensions\14\TEMPLATE\FEATURES directory.

-Uninstall Feature:

Uninstall-SPFeature FeatureFolderName
Here FeatureFolderName folder must be presented inside C:\Program Files\Common Files\Microsoft Shared\Web Server Extensions\14\TEMPLATE\FEATURES directory.

Tuesday, March 6, 2012

How to take backup & restore for one table?

We can take backup of table with schema and data.

Right Click on database
-Tasks
-Generate Scripts
-select a database
-Choose script options
select the script data option set to Schema and data only
-and proceed further....