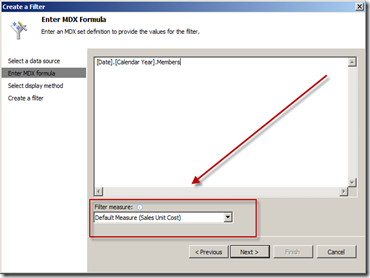
This is not a new concept, but for PerformancePoint it is. In Reporting Services you have always had the ability to setup parameters so that the selection in one parameter list would be able to filter the available values in another parameter list. Well now this has been added to PerformancePoint and it is available with the Multidimensional Filter types – Member Selection, MDX Query, and Named Set filter types. When you go to create a new filter of one of these types you will see a new setting in them. This new option is to select a measure (metric) that will be used to pass a query to the other filter to return the list of available values that satisfy that query.
Member Selection
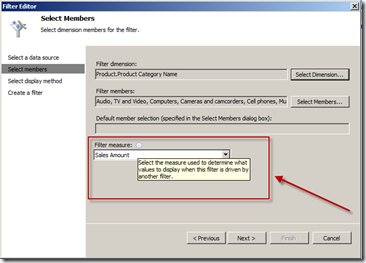
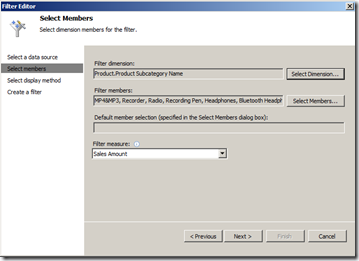
The new selection is the ‘Filter measure:’ option and the informational dialog box states the following:
Select the measure used to determine which values to display when this filter is driven by another filter.This is the measure (metric) that will be used in combination with the filter member values passed to this filter to display the available list of values to the end-user to select from. So if I had a filter that was for Product Category and passed that to another filter that was Product Subcategory and the Product Subcategory was configured with ‘Sales Amount’ measure then the Product Subcategory filter would display a list of items that had ‘Sales Amount’ for the Product Category items that were selected. A tad bit confusing perhaps, but this is how it works.
MDX Query
Named Set
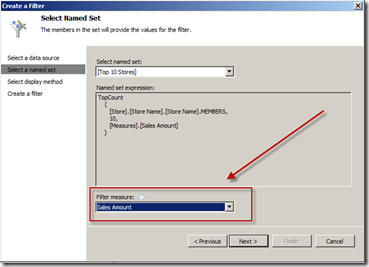
This option is not available with the other filter types, just the ones displayed above – Member Selection, MDX Query, and the Named Set.
Ok, so now that you have a tour of that new option lets setup a dashboard with a couple of filters and a report.
Create Filters
Member Selection – Product Category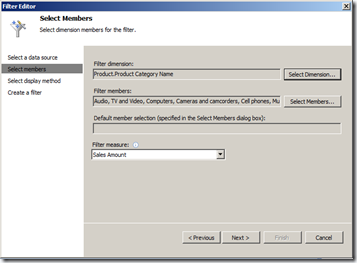
Member Selection – Product Subcategory
Create Analytical Grid Report
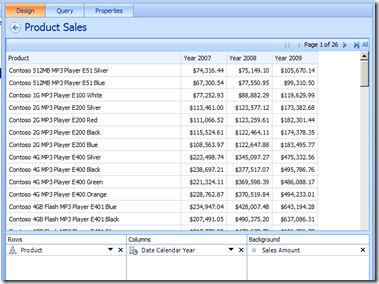
In this report I used the Product hierarchy and chose only the Product Name descendants of All, picked the Calendar Year hierarchy, and placed the Sales Amount measure in the background. I also used the filter option to remove blank rows and columns.
Create Dashboard and Connect the Items
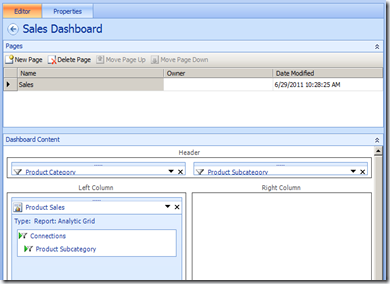
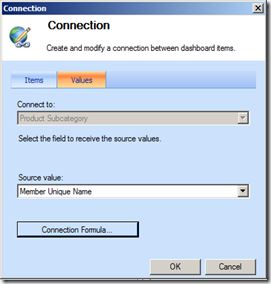
For the connections I connected the two filters together and then connected the Product Subcategory to the Product Sales report.
Connection to the Product Subcategory filter
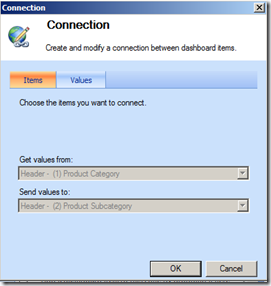
Connection to the Product Sales Analytical Grid Report – uses a connection formula as well
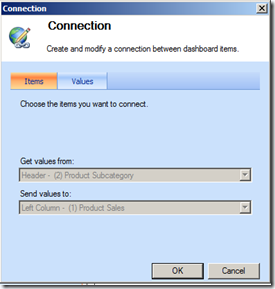
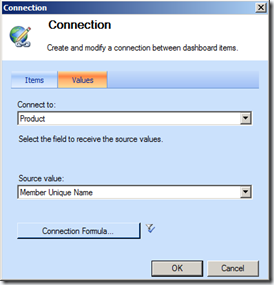
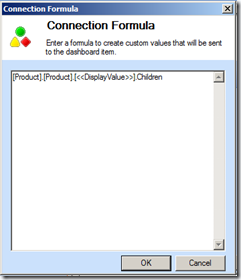
In this example I am leveraging a Connection Formula. The reason I am doing this is because the hierarchies that are involved in this example. I am not referencing the same hierarchy in each item and I want to be able to display the product names in the report instead of the subcategory values. So I am taking the display name in the subcategory filter and using that in a formula to return the children (product names) in the report.
Deployed Dashboard in SharePoint
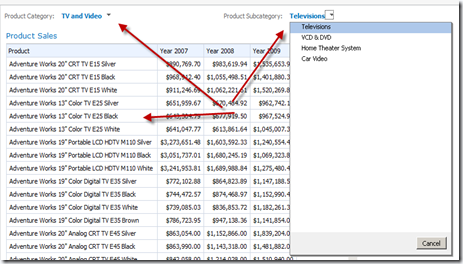
You can see that the subcategory filter is filtered by the category filter and only the ‘Tv and Video’ subcategory members are being listed. The subcategory filter selection is also filtering the report which is displaying all of the product names that are associated with the ‘Television’ subcategory.
If we make another selection in the category list we will see everything get updated again.
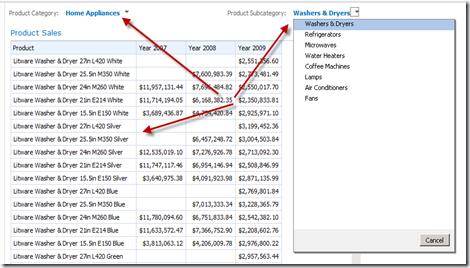
Pretty slick.
Ok, now on to the other new feature that was added into the service pack 1 – Apply Filters Button.
Apply Filters Button
When you setup a dashboard now you will see a new selection in the Details pane in the Filters section called ‘Apply Filters Button’.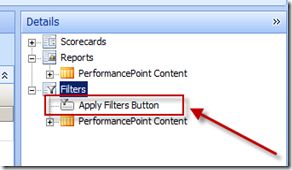
So what is this for? Hmmm, is this something similar to Reporting Services perhaps? Answer – Yes, with an added bonus.
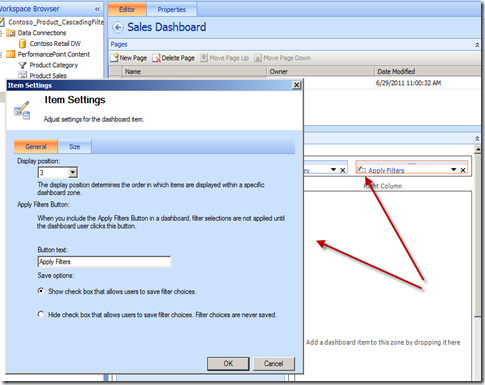
If you drag and drop this onto the dashboard page and go into the edit settings for this new item you will get some options you can configure. The first one is the text that you would like to be displayed on the dashboard page for the button. And the next one is whether or not you would like to provide a checkbox for the end users to be able to save their selections for this dashboard page – this will be stored as their default values for these filters. This means that when they come back to this page at a later time these filter selections will automatically be selected for them. In the past the last selection of items from the filters was always saved and stored for the users, but now they have the control to determine which values get saved (if you want them to – optional).
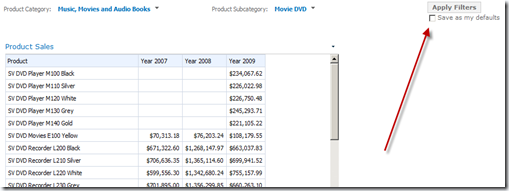
The other thing about this new feature is that when you make selections from the filters the items in the dashboard (with the exception of linked filters) will not be filtered. In order to get the other items to filter on the dashboard you need to click the button. Once you do this your scorecards and reports will refresh and display the data based on the selections in the filters (assuming they are connected of course).
I was hoping that this feature might somehow allow you to retain your default member selection settings in the initial filter setup, but that does not appear to be the case. The application still retains the last selection by the user unless you provide them the ability to save their own defaults with the new ‘Apply Filters Button’ option.
Anyway, these are just a couple of the new features along with hotfixes that are available in service pack 1.
Check out more information here:
Enjoy!
By the way, after I upgraded to SP1 the build version of Dashboard Designer was the following:
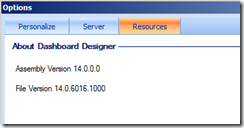
14.0.6016.1000Prior to the upgrade it was:
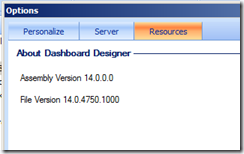
14.0.4750.1000I had installed a hotfix prior to doing the service pack 1 install. I wanted to check out some other fixes before this release – PerformancePoint Services 2010 (PPS) Hotfixes.
No comments:
Post a Comment